I stopped imaging the chromosomes using the 4 color scheme. While it produced some interesting patterns it wasn't really telling me anything. Besides the odds that I would stumble upon the right matrix by chance is pretty remote. The matrix being the number I tell the computer to put dots on the screen until it drops down and displays another line. I was using 37 because it was producing some good patterns. But I realized that's a completely subjective way to look at it. Also the patterns just indicated a mathematical quality to the repeating sequences.
I decided instead to approach the subject in an accounting manner. I've got several ideas planned but the first I chose already produced some interesting results. I wrote a program that counts the number of each type of Codon. In case you are new to the subject here is a primer or refresher.
A Codon is a set of 3 bases that code for an Amino Acid. Each position in the Codon has 4 possibilities; a, c, g, or t. In the Human Genome Project files, which are in some cases over 100mb containing 100s of millions of bases, there is a very long string of these letters and just these 4 letter. With 4 possibilities and 3 positions we can figure out how many possible combinations there are. The number is 4 x 4 x 4 or 64. So there are 64 different Codons. However there are only 20 or so amino acids. Some of the Amino Acids are coded for by different Codons.
I told the program to simply count every time it came upon aaa, aca, aga, agt, etc. All 64 possibilities and to produce a simple graph of the results. Every 10,000 Codons I told the program to subtract the latest total from the last total for each Codon. So for example in the first sample of 10,000 there were say 1,221 of aaa. Then in the next batch of 10,000 there were say 1321. The resulting number that I would graph would be 1321 - 1221 which is 100. So between set 1 and set 2 the Codon aaa occurred 100 more times than before. With 64 lines of data and changes this large it became impossible to graph all 64 Codons at the same time. I instead employed a reduction technique by dividing my answer by 20 and then graphing that. So in the previous example I would have graphed a change of 5 instead of 100. This would still give me the gist of how much change there was from set to set.
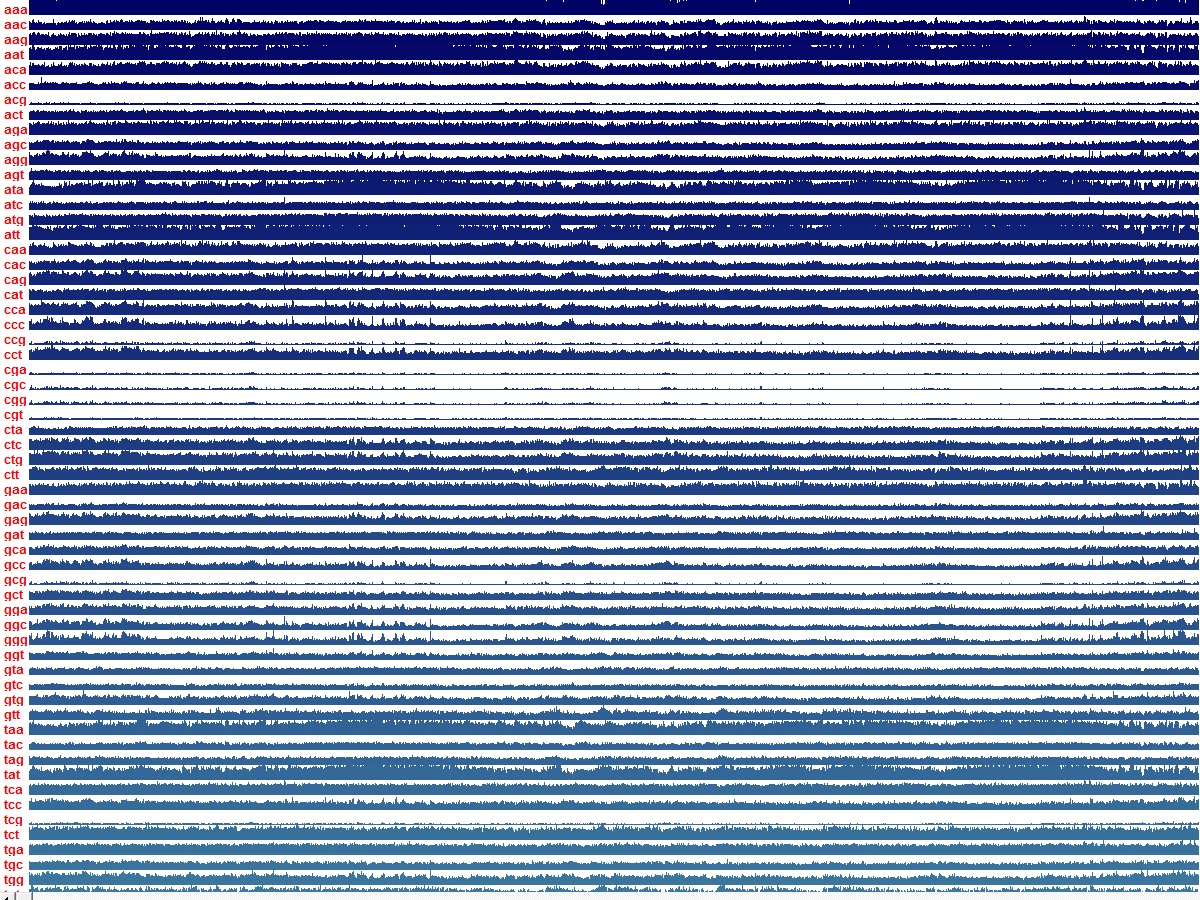
Right off the bat I noticed something odd. Here is a screen capture of that first run. This is Chromosome 1. Each single bar on the graph is a chunk of 10,000 Codons or 30,000 bases.

If you click on the image you should get a full size view but this image as is will show you what I saw. There are two patterns that stand out immediately. Also note that the entire 64 Codons are not represented. They started running off the screen in the series of Codons that begin with "t". I am working on changing the program to display them down the screen instead of across since monitors are wider usually than they are tall but that's later. I looked at the data below the screen and the patterns hold true so I wasn't that worried about it just yet.
One thing you will notice is the "blank lines" going down the image. Those are points in the file where the sequences are missing. They are represented in the files with the letter "N". In other words the Human Genome Files, or at least the ones I got for NIH are not complete. For whatever reason the complete files, if there truly is indeed a true full human genome successfully sequenced, I have yet to find those files.
Moving on. The next thing you should see is the 8 lines that are nearly flat compared to the rest. These occur in Codons ccg, tcg, gcg, acg, cga, cgc, cgg, and cgt. Which is interesting because you can group them in two groups. Codons that begin with cg and Codons that end with cg. It appears that within groups of 10,000 Codons that contain the two bases c and g or Cytosine and Guanine change little when compared to the other 56 Codons. There also seems to be a pattern with several Codon types such as those with "ta" but I haven't looked deeper into that just yet.
The next pattern you may notice is that where one set of Codons rise another set, and a particular set at that, dips. I will be looking into that. Perhaps writing a program that mirrors one Codon data set flipped above another such as the line for aga over ggc and see if they fill each other in. It would be interesting if they did. It would perhaps show a relationship between Codon pairs. If you look up and down the graphs you will see this phenomenon repeated everywhere. And while at first this seems weird its really not. It actually makes sense for the most part. Obviously if there is more of a certain Codon in one area then there must be a deficiency of another simply because another is there instead of another. However you would expect this to not be so uniform. I wouldn't say random because DNA is anything but random. It is perhaps the most highly sophisticated code one can imagine. Well beyond computer code that is for sure. Far more dynamic. To compare DNA code to computer code it would be like writing a computer code that when run builds more machines for it to run on but at the same time the code itself is actually a physical template for the new machine. A crude analogy I admit and pretty much impossible as we understand computers. Perhaps a computer that exists in a "natural form". Whatever that might be. DNA and the universe itself appear to be such a code. The question is did it get here on its own or did it have help. Suffice it to say that there are a lot of physicists and big brained people who are starting to suspect we are in some type of simulation. It sure seems that way.
That is the subject of a much longer blog I am working on and have been working on before blogs were even invented. But I digress. On with the Data Show!
This may be a way of classifying Codons in a taxonomic fashion. Such "cg" species and "ta" species etc. That is one aspect I will be looking at. I will most likely need to get a couple more of my computers working on these side chain ideas. Which may be easier said than done since just while writing this I am noticing more and more anomalies to examine.
Sticking with what I have done so far however let's continue. Of course looking into 1 chromosome does not a trend make. I discovered while running my imaging programs that any two chromosomes, while sharing distinct repeating patterns across the entire 23 chromosomes can have remarkably different features. Chromosome 19 comes to mind with more mathematical patterns per millions of bases than I saw in the others. Patterns like this below.

If you have been reading my blog, which few do apparently, you will remember this is simply a set of colored points laid down back and forth like beads on a string. Each base was assigned a color. Red for a, Green for c, Blue for g, and Yellow for t. I read the data straight out of the files and told the computer to use small bmps I created with those colors and to lay them down for a certain length, then move over and go back the other direction. This particular method drew up and down from left to right. Later I used the method of back and forth across the screen. The strips you see are due to the number, in this case 33, assigned to the matrix. When the program encountered the 34th base in the file it moved over and started up, then when it got to the 67th it moved over and started down, and so on. That way I could get several panels of patterns on one display page.
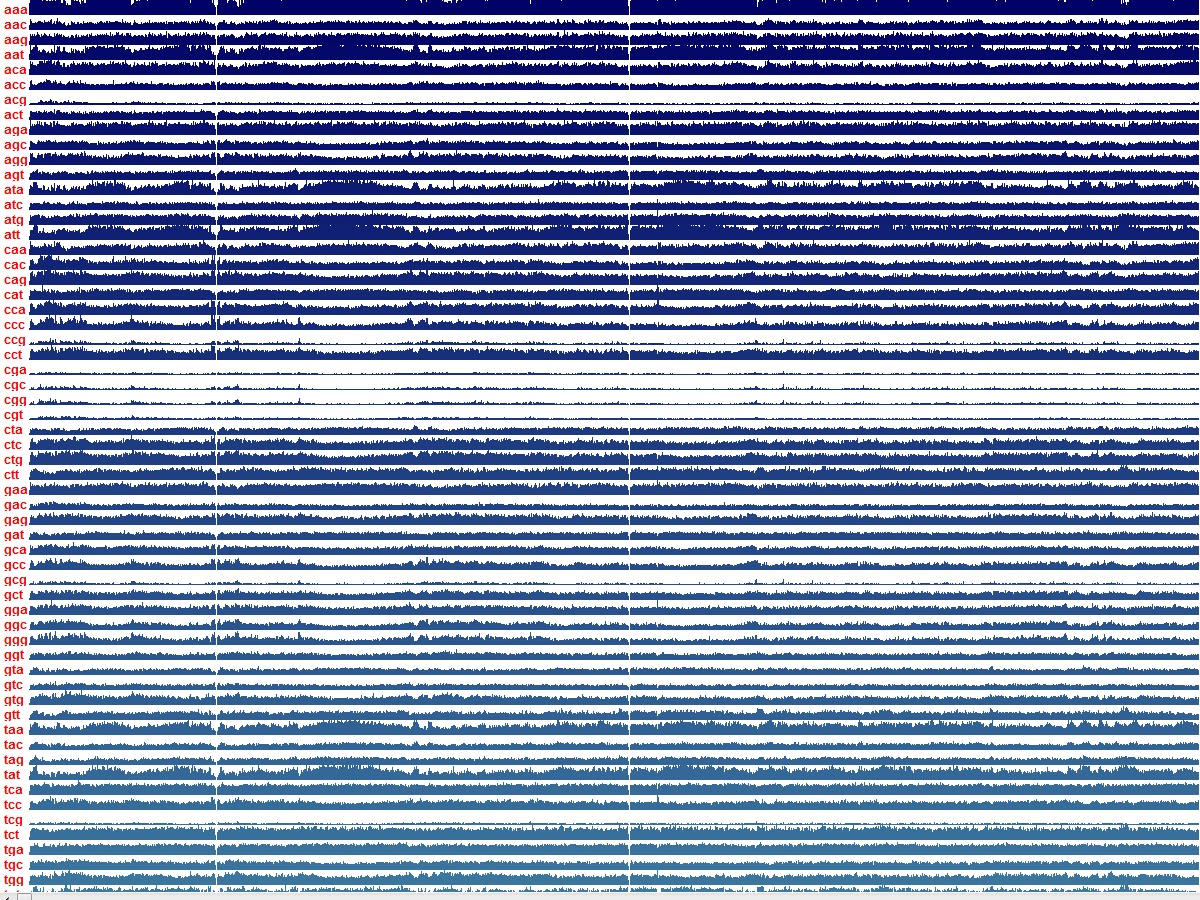
With the current program I then moved on to different chromosomes to see if the same pattern occurred again with the "cg"s. And it did. The next few images are of chromosomes 7, 9, 10, and X. Chromosome 12 is currently on my other computer waiting for me to graph it. I am pretty sure when I get through all 23 chromosomes I am going to see the same thing. Here are those other chromosomes.


I will test these images after I publish this entry to make sure they expand when clicked.
As I said. I expect to find this for every single chromosome. However I knew that I had manipulated the output by dividing the original result by 20 to make it fit on the screen. This does not change the fact that clearly there is a pattern in the cg's but I wanted to see what those lines looked like without the manipulation so I isolated them to give myself room on the screen. Removed the divisor of 20 and spaced them far enough apart to see the results. This is what those squashed lines look like without the data reduced.


So as we can see there is some change from each set of 10,000 but when compared in squashed format alongside the other Codons the change isn't much. There must be a great deal of change from set of 10,000 to set of 10,000 in some of the others that even with the data squashed they still produce greater peaks and valleys when graphed. But something even more interesting is that between this particular "species" of Codons there is another pattern that emerges. Apparently they change together during each block of 10,000. I realize now I should have done another species of Codons for a comparison to show here and I will certainly do that as soon as I am done with this entry. I will add it later so you may or may not see that depending upon when you read this.
I also realize that the transcription position of the Codons might make a difference as well. If a base is ignored or a sequence is ignored that throws of the Codon sets and it might make a difference. For instance if the data line acgggattgaaaccag is started at the first position you get Codons acg, gga, ttg, aaa, cca, g..... However if for whatever reason the first position is ignored the sequence of Codons would be cgg, gat, tga, aac, cag. Which should produce a different pattern right? So of course I tweaked the program to skip the first letter and thus change the entire Codon set. Here is just one of the results.

This could be an aberration. The sets of "N"s in the files don't necessarily occur in rounded sets of 3's so that if there were say 2 extra N's in a set beyond an even number of sets of 3 then say a Codon set at the end of a string of N's such as NNa or Naa or Nca or what have you would not have been counted since I compared each set of three bases to a complete list of 64 possible Codons. None of which used "N". so they were ignored as you saw with the blank lines. I don't think however this is the case but I will check it further. This would only show up after each section of "N"s in the data. But this also occurred with X chromosome and chromosome 1. The cg species still showed this quality which would lead me to think that sets of cg's occur in strings so that a string of data such as cga ccg ccg caa gcc gac gaa cgg gga cga occur dis-proportionally low compared to other sets. Take the string I just put up. If you start from position one you get Codons cga, ccg, ccg, caa, gcc gac gaa cgg gga cga, which yields 5 Codons of species cg. If you start at position 2 you get gac cgc cgc aag ccg acg aac ggg gac ga This produces 5 of species cg. What does that mean? I don't know. The point being that perhaps DNA is constructed in a way that its hard to lose the code. The so called Stop Codons are the mechanism DNA uses to make sure this doesn't happen but it doesn't seem to change my results.
Here is a link showing the Codons and what they code for.
https://users-cs.au.dk/chili/PBI/Exercises/codon_translation.html
One thing you will notice is that when the Codon begins with cg as in cga, cgc, cgg, cgt that they all code for the same Amino Acid namely Arginine. When the cg species is at the end of the Codon you get four different Amino Acids. I am curious about, and will pursue, the idea that the ones that code for Arginine have a pattern of their own or contribute to the pattern more strongly which would indicated perhaps a function to Arginine in the process of transcription. This may already be known. I don't know. I don't read up on the material. I don't want to be influenced by other theories. After enough time has gone by I will look to see how much, if any, of my own personal research has become public knowledge.
I will post more as the results come in.